Aoni Campaigns: taking a Hong Kong condom brand into North America on a joke.
The launch opened on a hard sell and almost nobody answered. The most expensive post of the campaign is the one that proves where the audience actually was.

A world record is only a story if somebody has heard of you.
The product had a Guinness record and no reason for a North American shopper to care.
AONI makes condoms in Hong Kong, and its lead product held a Guinness World Record as the thinnest latex condom made. In North America it was arriving into a shelf owned by Durex and Trojan, through Amazon and its own store rather than a retailer, with no recognition to trade on.
The brief I wrote set three goals: a consistent identity, a brand people could relate to, and an audience that stayed. It left the method deliberately open, listing both promotional posts and humour. That openness is the reason there is anything to measure.
The first six posts asked people to buy something and averaged seven likes.
Across the whole run, the posts carrying a link engaged one per cent of the people they reached.
June ran the obvious campaign: the record, the Amazon listing, free shipping over twenty dollars, an article about relationships with a link under it. Six posts, between three and eleven likes each.
That pattern held all summer. The six link-bearing posts reached 37,153 people and engaged 378 of them. The page was doing what a launch is supposed to do and the audience was walking past it.
| what the post asked for | what came back |
|---|---|
| buy this, here is the link | Six posts. 1.0% of the people reached did anything at all. |
| read this article we found | Reliable reach, almost no response. The best of them managed 3.0%. |
| know this about the product | The record, the pack size, the shipping offer. Between five and eleven likes. |
| nothing | The format that followed. 11.0% across every post that ran without ad money behind it. |
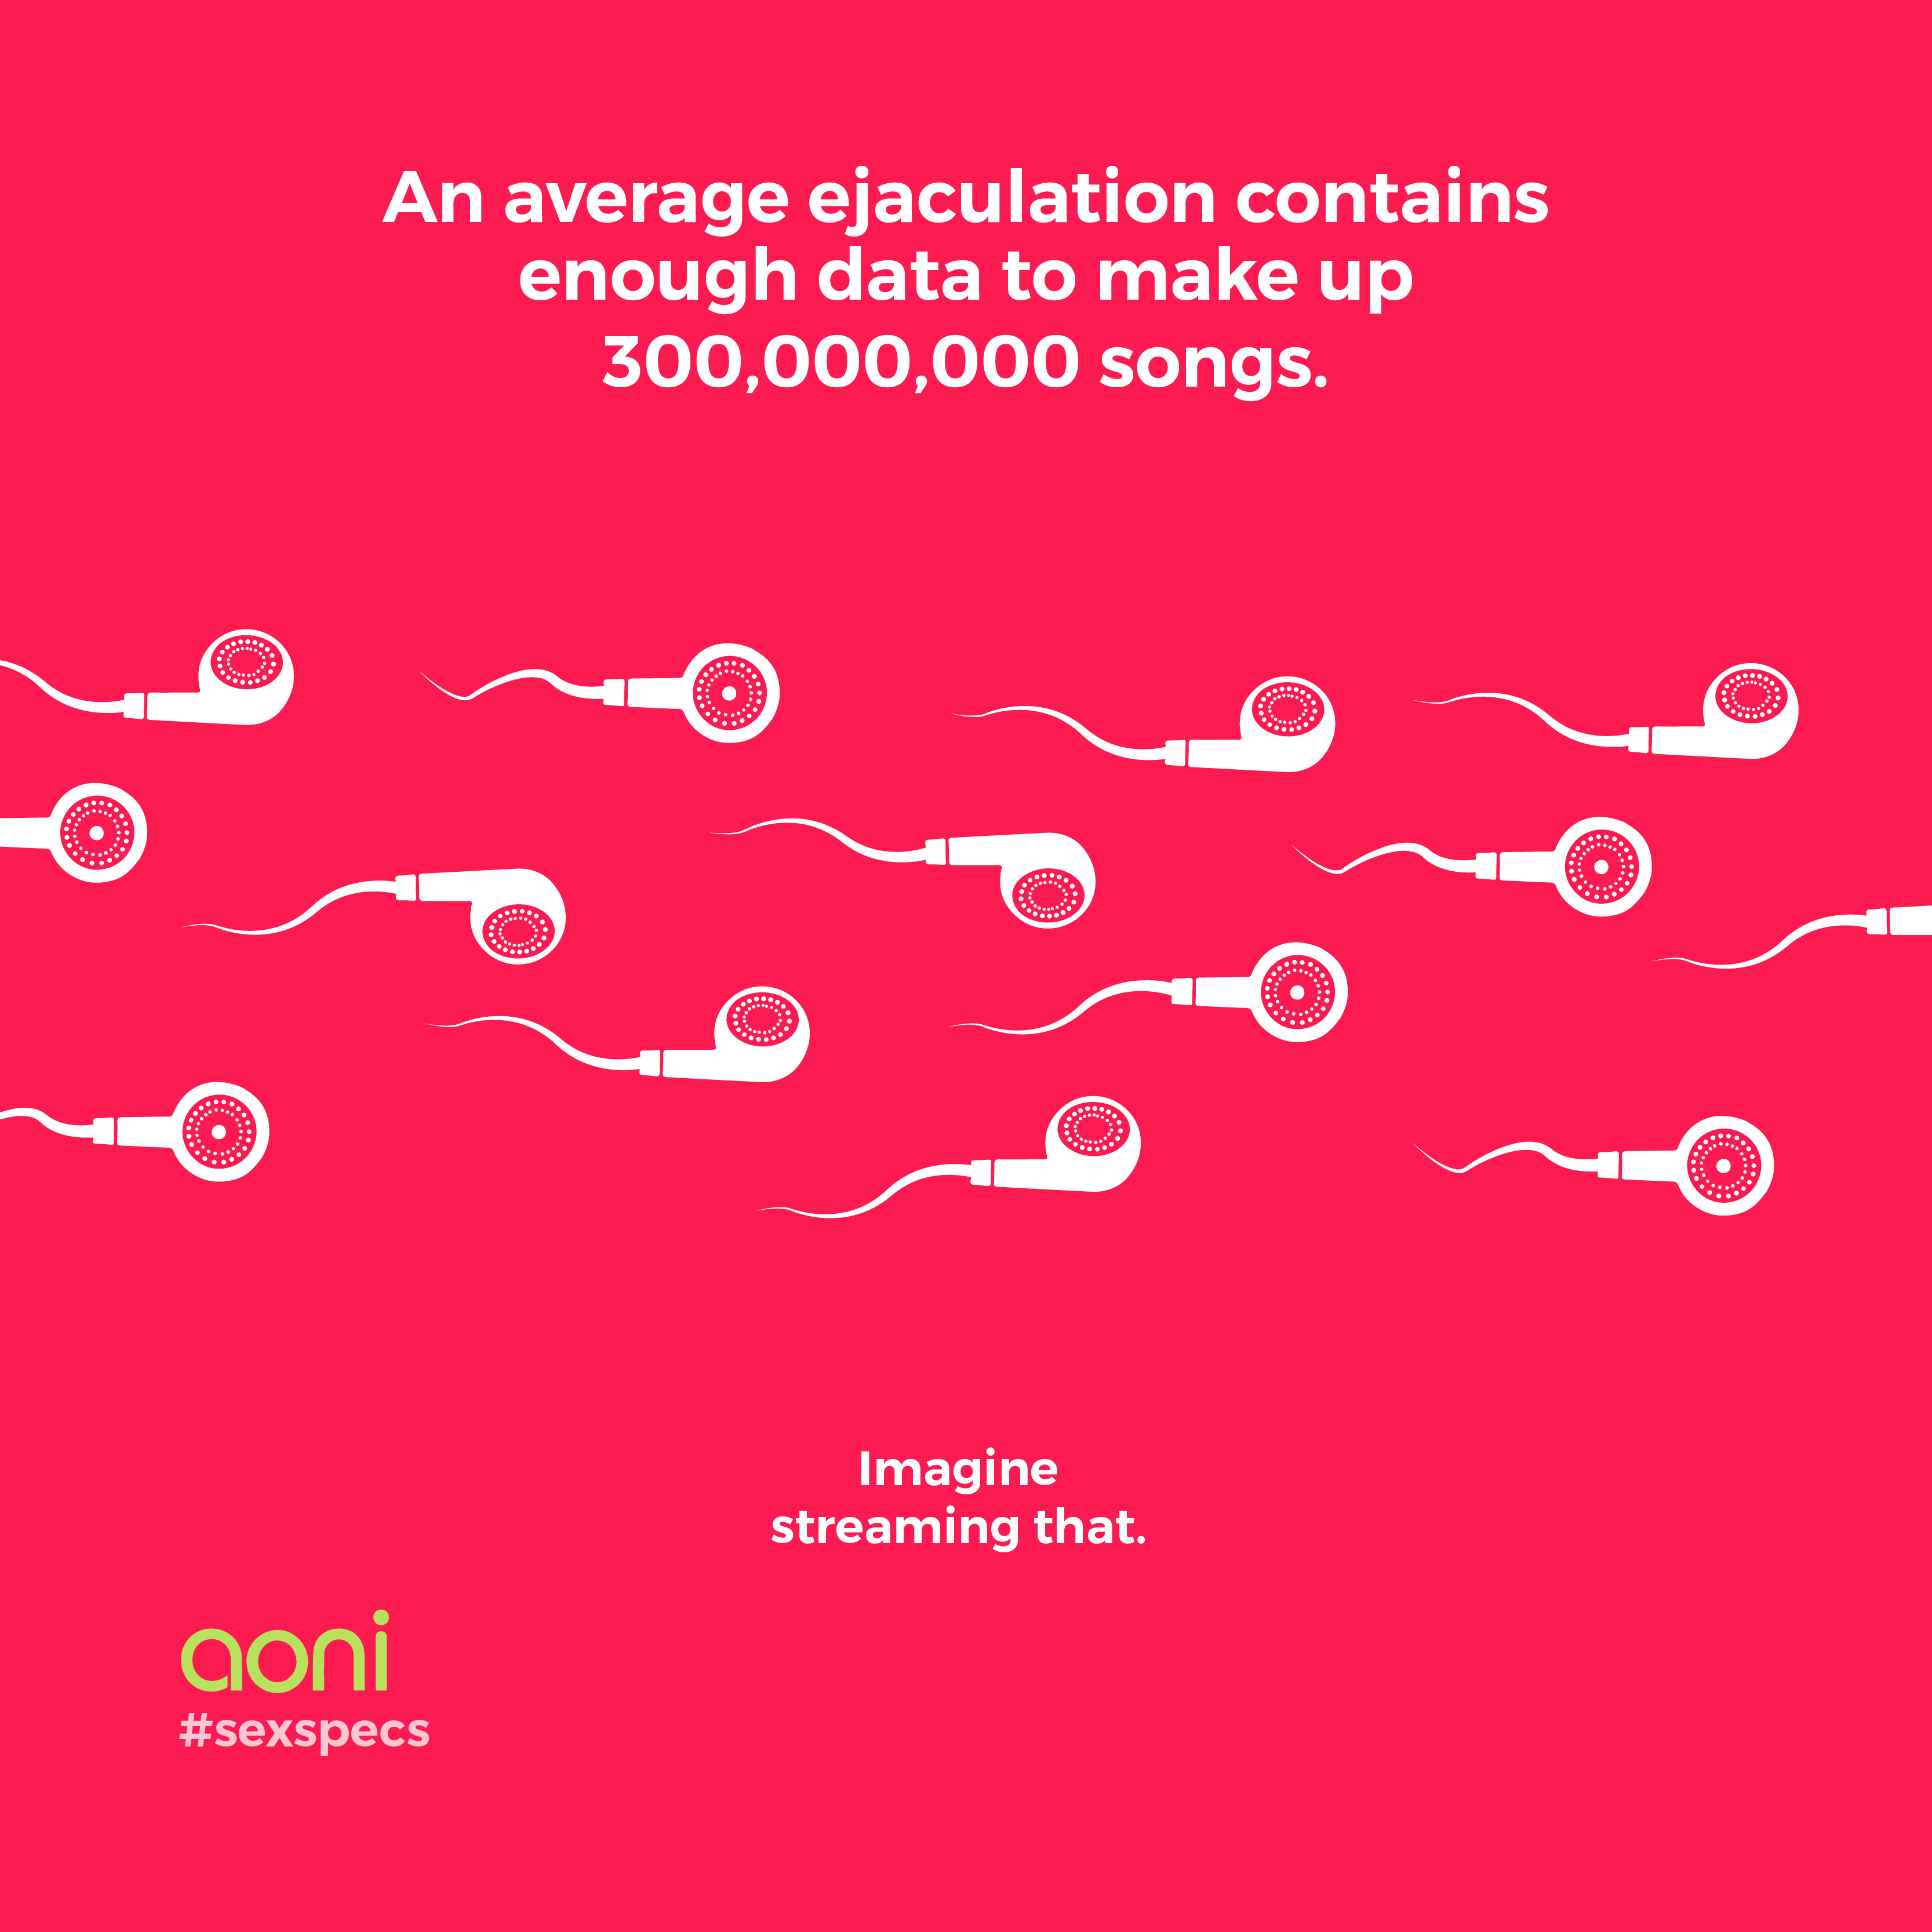
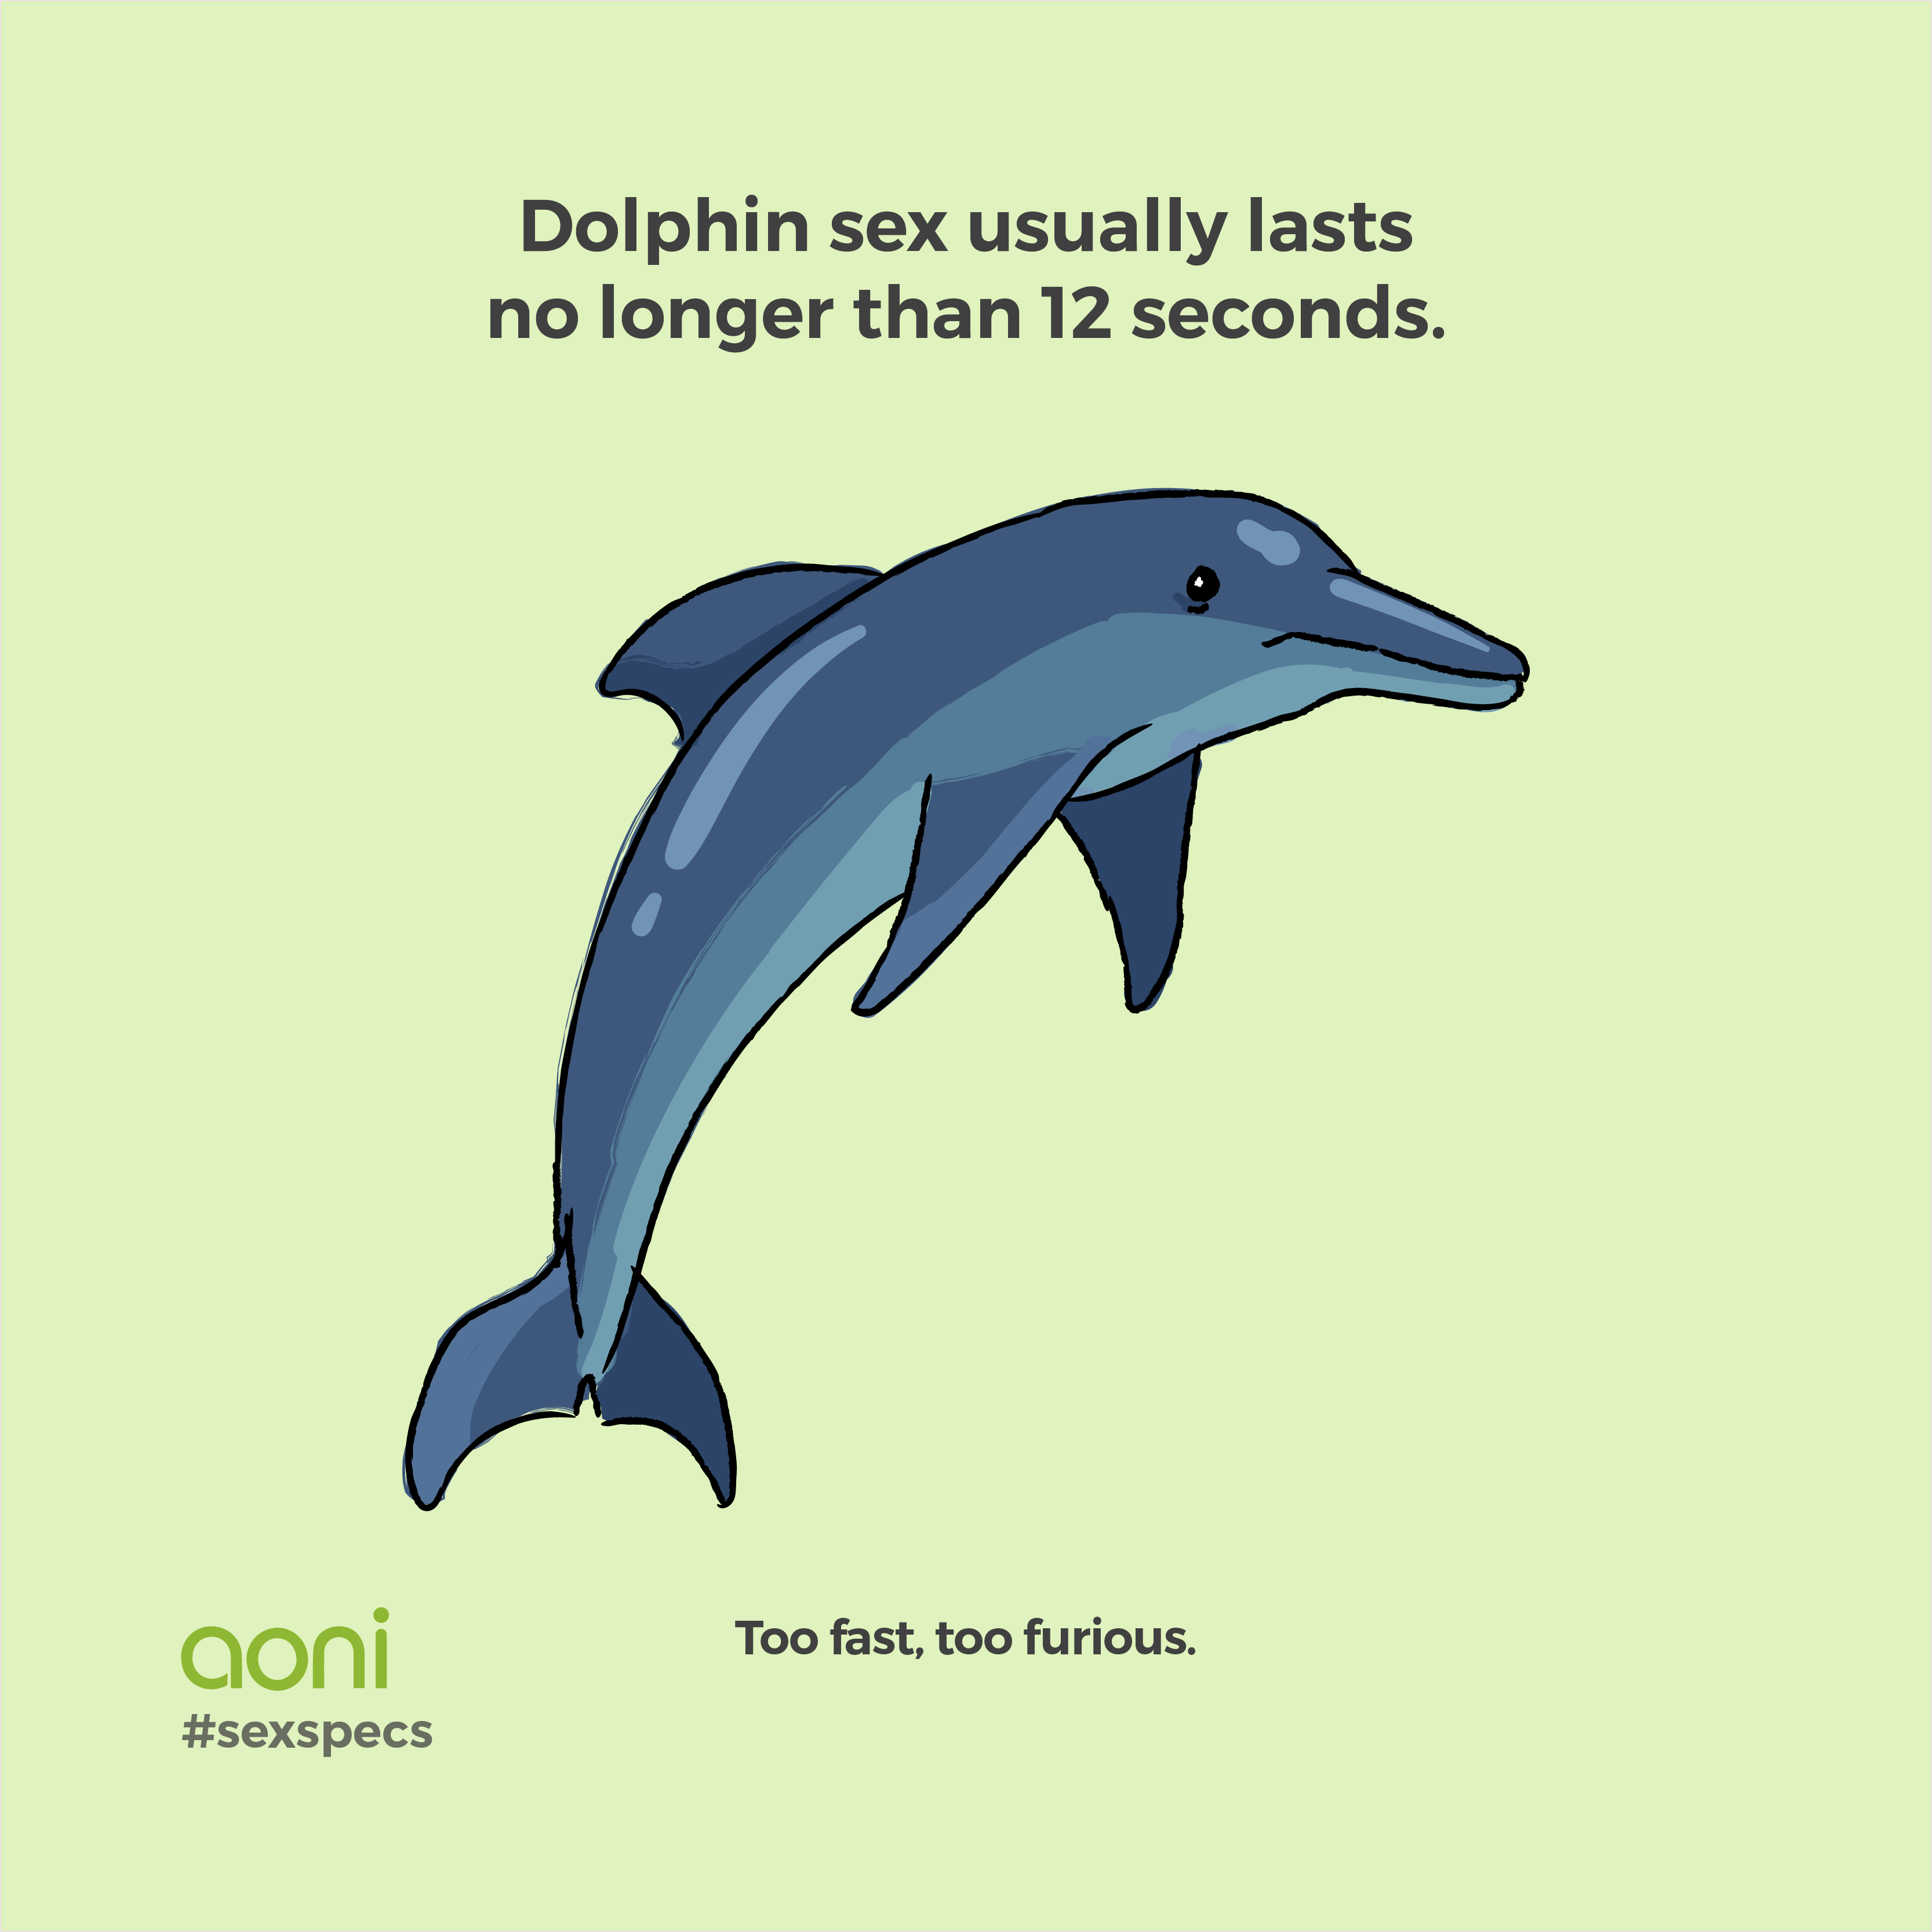
#SexSpecs was one fact, one punchline, and nothing to click.
A sexual-health fact people would repeat, a flat illustration, and a joke underneath it. No product in the frame.
From mid-July the page ran one shape and kept running it. A piece of sexual-health trivia at the top, an illustration, a one-line joke at the bottom, the wordmark small. Dolphins, hamsters, a grandmother knitting socks. The product is not in the picture and there is nowhere to click.
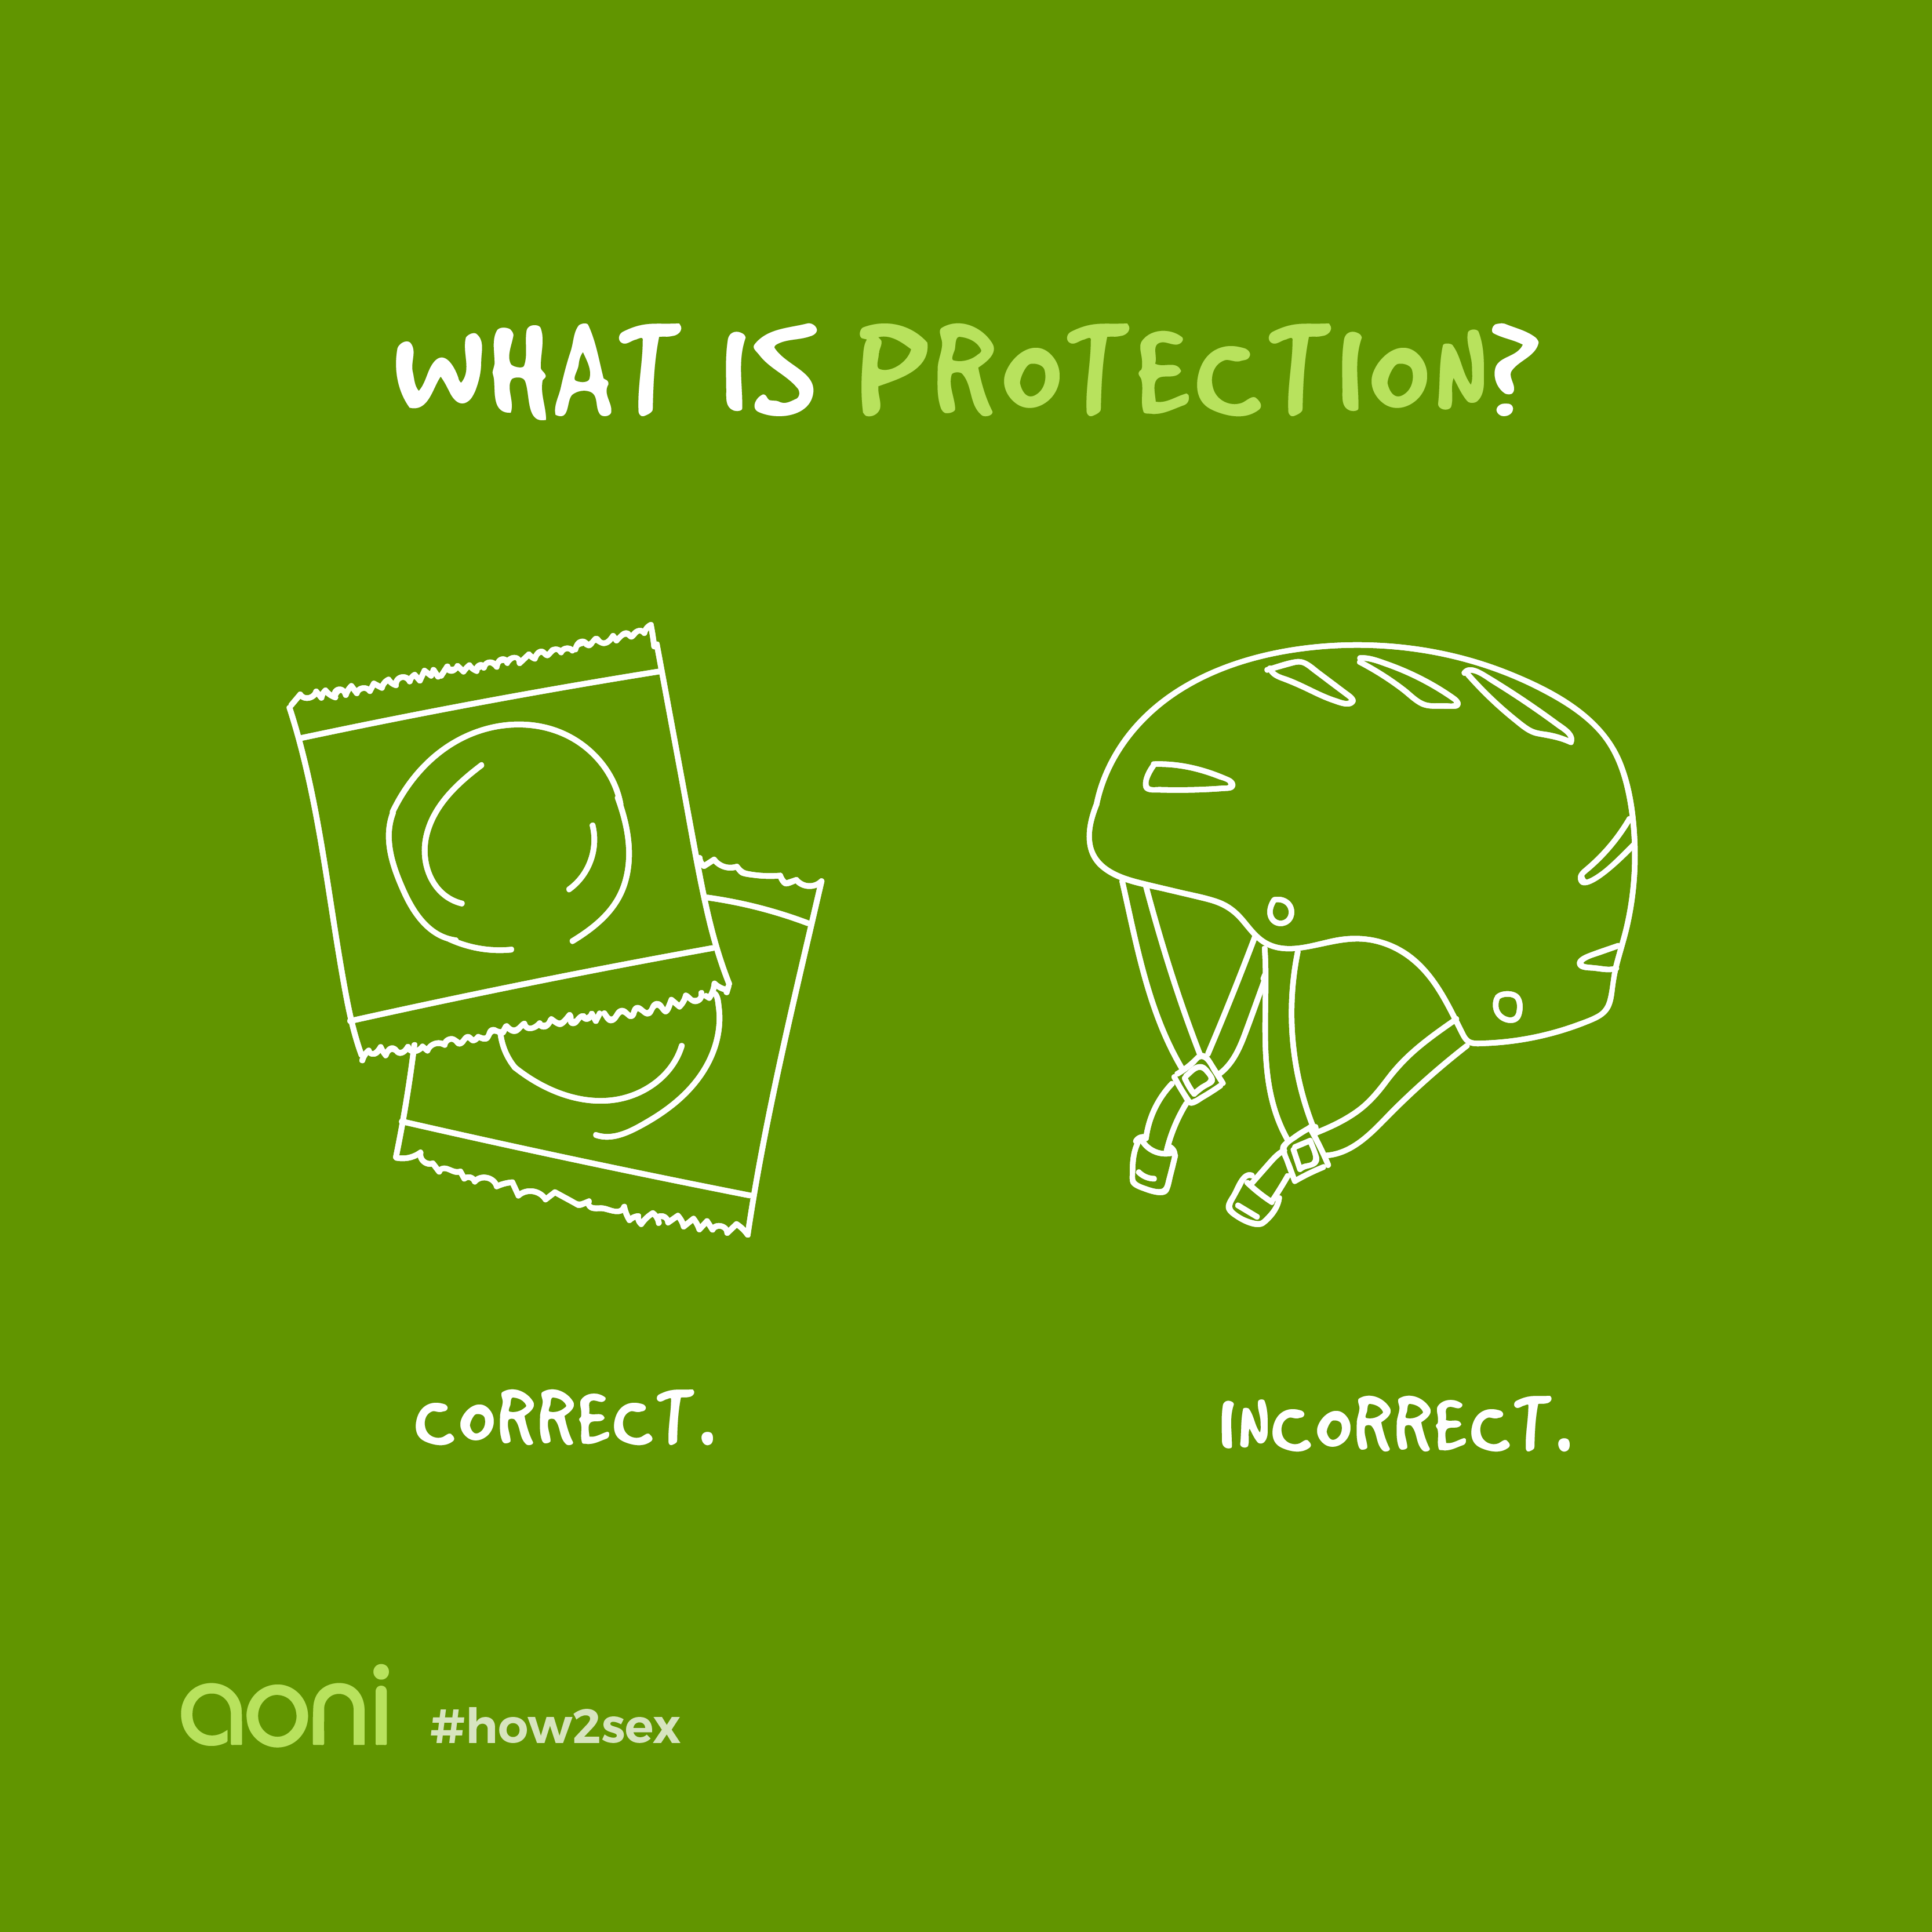
Six consecutive posts in July engaged between 20.5% and 22.3% of the people who saw them, against the one per cent the link posts were managing. In the autumn it became #how2sex, a drawn question-and-answer card, which is the same idea in a second costume.
-
-
-


The most expensive post reached 75,333 people and engaged 181 of them.
Buying an audience and earning one turned out to be two different purchases, and only one of them showed up in the likes.
In July the page put its largest promotion behind a video addressed to Apple. It bought more reach than anything else in the campaign, 72,315 of its 75,333 people paid for, and returned an engagement rate of 0.2%, the worst of the forty posts. Money bought the room. It did not buy anyone's attention once they were in it.
I kept spending anyway, because reach was the number the Hong Kong office could see. The budget should have moved behind the posts that were already winning without it.
posts with ad money behind them 16 posts
posts that ran on nothing 24 posts
One format produced 92% of every like the page ever earned.
Two posts carried the campaign: 658 likes in July, then 1,448 in August, from a page that had been getting six.
Forty posts reached 220,685 people and collected 3,561 likes. The #sexspecs and #how2sex posts account for 3,272 of them. Page likes went from 5,966 to 7,104.
Two posts did most of the work. "Welcome to the 99%" in July took 658 likes and 124 shares; "Do what you need to get the job done" in August took 1,448 likes and 149 shares. Against those 220,685 people, the campaign drew 49 hides and unlikes in total. A brand in a category people are meant to be squeamish about made jokes for four months and almost nobody objected.
junejulyaugustseptemberoctober
I called it a test. It was a before and after, with three things changing at once.
The finding survives the weak method. The claim I made for it at the time did not deserve to.
The formats ran one after the other. When engagement rose in July, the format had changed, the page had grown, and ad money had arrived, all in the same three weeks. I reported it as though the format alone had done it. The twenty-four posts that ran on nothing are the only reason the claim survives, and I did not design that slice. I got lucky with it.
I also never asked why the joke worked. There were 184 comments across the campaign and I read none of them as evidence. Today I would run both formats in the same weeks against the same audience, and treat a comment thread as something to analyze rather than something to reply to.
| what changed | what it could account for by itself |
|---|---|
| the post format | The thing I claimed. Product asks became facts and jokes. |
| the size of the page | Every post after July reached a bigger audience than every post before it. |
| the ad spend | Arrived in the same weeks as the format, behind some posts and not others. |
| what isolates it | The twenty-four posts with no spend behind them, which still ran at 11.0%. |
Where these numbers come from, and the two posts left out provenance
Every number above is re-derived from two Facebook Insights exports dated 13 October 2015, one page-level and one post-level, kept since the engagement.
The archive holds an earlier pair under the same filenames. Those carry a different column layout and disagree on organic reach and negative feedback, so they are a second instrument rather than a second reading, and nothing here mixes them.
Forty-two rows, forty posts. A cover-photo change reports seven people reached and sixty-nine engaged, an impossible 985%, and the page-description post reports zero reach. Both are page events rather than posts, and both are excluded throughout.